Erudus launch Environmental Impact Scoring on Product Specifications in partnership with Mondra






Back in July at the Erudus User Forum we announced environmental impact scoring was coming to Erudus specifications. Well, the time has arrived and the roll-out process has begun...
We’ve partnered with supply chain intelligence experts Mondra to furnish Erudus product specs with a suite of Environmental Impact data with an overall Carbon intensity score - calculated via a scale that Mondra has developed to report the carbon intensity of a product based on their methodology.
The Environmental Impact attributes and Carbon Intensity scores will appear on specifications with no additional information needing to be provided - Mondra’s methodology can be done with existing information on a finished Erudus specification.
Here’s everything you need to know...
What does this environmental scoring mean in the context of Erudus specifications?
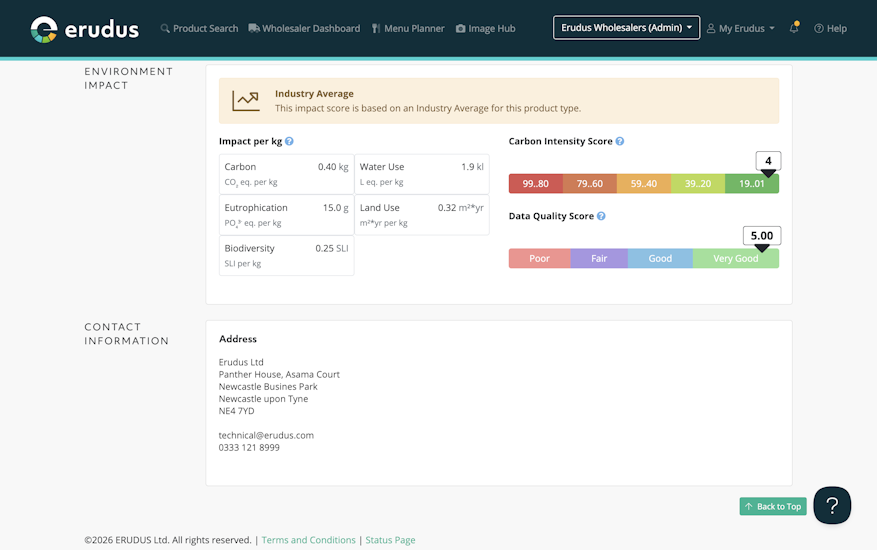
On published Erudus specifications there will now be an “Environment Impact” section which will detail a suite of environmental impact attributes with colour coded scales for the carbon intensity score and the data quality score.


What is included in the suite of environmental scores that will be available on specifications?
The suite includes the following:
- Carbon (CO2 equivalent per kg)
- Water Use (l equivalent per kg)
- Eutrophication (Phosphate equivalent per kg)
- Biodiversity (Species loss index value)
- Land Use (m2 per year)
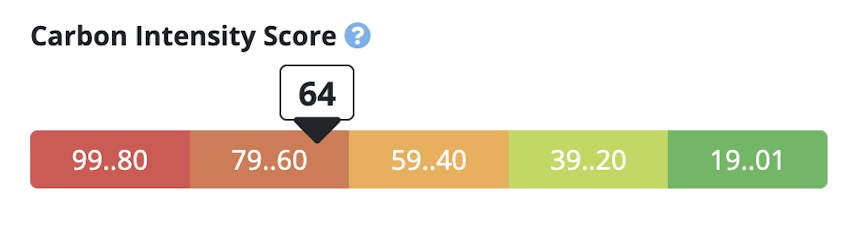
- Carbon Intensity (Mondras calculated score between 1-99 based on their calculations/methodology)
- Data Quality Score (The quality of the data used to provide the environmental impact values based on the primary data provided)
You can find a more detailed explanation of the above scores at the bottom of this story.
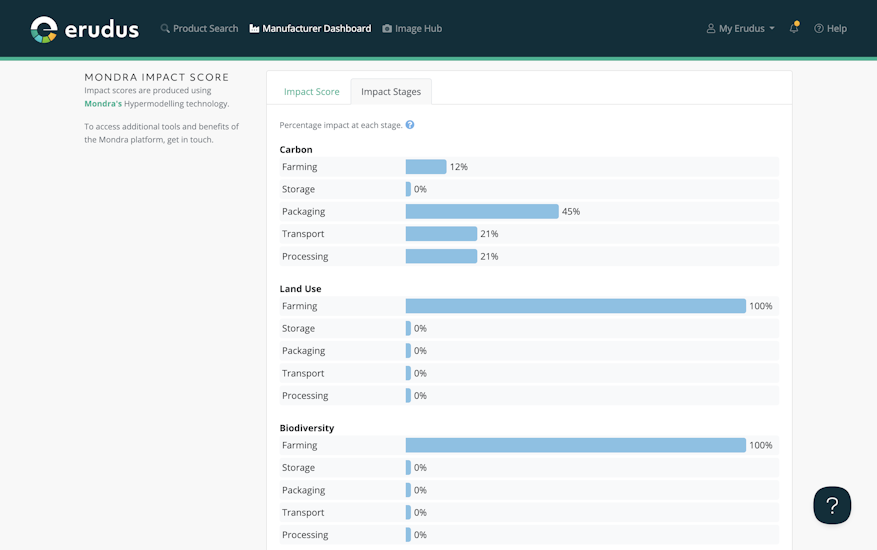
Manufacturers will also have access to an "Impact Stages" chart that details the level of impact that different stages of producing the product have on the Environmental impact attributes. This is broken down into:
- Farming
- Storage
- Packaging
- Transport
- Processing
Meaning each environmental attribute (Carbon, Land Use, Biodiversity, Water Usage, Water Pollution) for a product will have a percentage breakdown of which stage of production has contributed the most.
Why have we introduced environmental impact scoring?
At Erudus it’s important to us that our Data Pool includes all the product information our users want to see, and we’ve identified a growing interest and demand throughout the supply chain to understand the environmental impact a product has when it is produced.
Some key observations:
- Consumer mindsets are shifting to be more environmentally focused when making shopping/dining decisions.
- Caterers are being asked to provide environmental impact data for their menus, and need a way to provide the requested data.
- Wholesalers who want to create sustainable supply chains and meet sustainability targets need to know the environmental impact of the products of their suppliers, and their catering customers are increasingly requesting this information, particularly public sector Caterers and contract catering companies.
- Many Manufacturers don’t have the time or money to invest in hiring external companies to audit their products and manufacturing processes to provide them with the necessary environmental impact data.
By partnering with Mondra to calculate Environmental impact and Carbon Intensity scores for Erudus products, we can provide Erudus users with a standardised set of data using the same methodology.
You may also be interested in…


You may also be interested in…
Erudus Update: Erudus ESG survey for Manufacturers
ReadThis means that comparing the environmental impact of 2 products in Erudus is a true comparison.
This feature gives also gives Erudus Manufacturers that previously weren’t able to provide carbon impact data for their products on request the ability to do so - reducing the administrative burden and financial overhead of having to engage a 3rd party.
How will users be able to see their carbon impact score?
Anybody that views a specification in the portal will see the new "Environment Impact” section near the bottom of the specification (if the calculated data is available). This will have the data for:
- Carbon (CO2 equivalent per kg)
- Water Use (l equivalent per kg)
- Eutrophication (Phosphate equivalent per kg)
- Biodiversity (Species loss index value)
- Land Use (m2 per year)
- Carbon Intensity
- Data Quality Score
Manufacturers will have a button at the top of the specification labelled “Impact”, which will allow them to view both the "Environment Impact” and “Impact Stages” data for a product.

How will the scoring appear on the product specification?


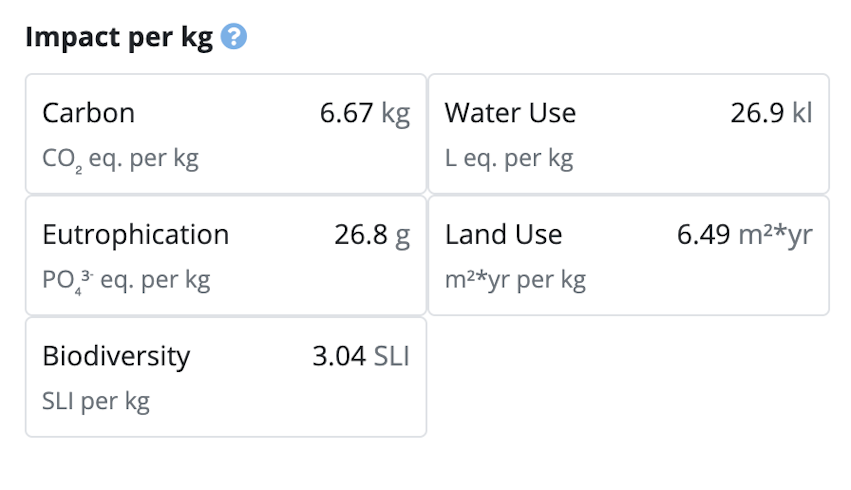
The attributes and their values (Carbon, Water Use, Eutrophication, Biodiversity, Land Use) will be detailed in a table on the left-hand side.
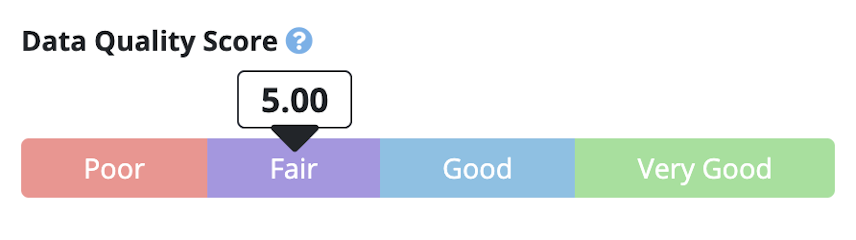
On the right-hand side will be colour coded sliders showing Carbon Intensity and Data Quality Score.




Not all products will have a product specific score - in instances where the current data provided is not enough to calculate a product specific score, an industry average score for that product category will be displayed instead (there will be a visible banner on the specification explaining this). Those Manufacturers with products where only an average is available but who want to have a calculated score are advised to consult this article on Erudus Knowledge Base.
How is the score calculated?
Mondra, our partners in this venture, use the existing data on Erudus food product specifications (where enough information has been provided) to make their calculations.
Mondra uses life cycle assessment (LCA), which looks at a product's whole journey rather than a single stage - the growing or rearing of its ingredients, processing, packaging, transport and storage. The result is a set of 5 impact figures that describe different types of environmental pressure.
You can find out more about the individual calculations and their criteria at this Knowledge Base article, or the bottom of this story. Additionally, we’ll be co-hosting a webinar on 16th September in which Mondra will explain their calculation process further and answer any questions you might have. You can find out more about signing up here.
When is environmental impact scoring going live?
The rollout begins today, 7th September! Over the coming weeks you’ll see these scores appear on Erudus product specifications as Mondra work through our Data Pool.
Following that, we’ll be announcing industry average comparisons and explaining additional data availability via Mondra and their services. Manufacturers will have the option to engage with Mondra to get more in-depth analysis of their products Environmental Impact and Carbon Intensity by providing more detailed data, and will be able to do so through Erudus while reviewing their products Environmental Impact information.
You may also be interested in…


You may also be interested in…
Erudus & Mondra: Environmental impact scoring comes to Erudus specifications - 16th September
ReadYou can find out more about this in the Environmental Impact Scoring webinar.
Need help understanding environmental impact scoring on Erudus specifications?
Erudus and Mondra will be co-hosting a free webinar lifting the lid on the importance of this scoring, and how it works. The webinar takes place on the 16th September at 2pm and will be hosted via Microsoft Teams. You can find our more about what it will cover and how to sign up here. You can also visit the Erudus Knowledge Base article on Environmental Imapct Scoring here.
Breakdown of the suite of attributes
Carbon (CO2 equivalent per kg)
A measure of Greenhouse Gasses (GHGs) that are emitted when creating the product. GHGs trap heat in our atmosphere and drive the climate to change just like a greenhouse for your plants. Some of the big culprits are carbon dioxide (CO2), methane (CH4) and nitrous oxide (N2O).
The greenhouse gas emissions released across the product's life cycle. Several gases contribute to climate change — carbon dioxide, methane and nitrous oxide among them — so all of these are converted into the equivalent amount of carbon dioxide and reported as a single figure. This is the metric most people mean when they talk about a product's carbon footprint.
Water Use (l equivalent per kg)
Technically this is a measure of Water Scarcity. It isn’t just the freshwater that is used but also where it’s drawn out of the ground and then multipied by a number based on how scarce freshwater is at the location.
The volume of fresh water consumed to produce the product, most of which is usually taken up by irrigating crops or watering livestock. The figure is weighted for water scarcity, so a litre used in a region under water stress counts for more than a litre used somewhere with a plentiful supply. Large values may be displayed in kilolitres (kl) for readability.
Eutrophication (Phosphate equivalent per kg)
PO43- eq. per kg
The effect of nutrient pollution on rivers, lakes and coastal waters. When nitrogen and phosphorus from fertiliser or manure run off into waterways they trigger excessive algae growth, which starves the water of oxygen and kills fish and plant life. All contributing nutrients are converted into an equivalent amount of phosphate so they can be reported together.
Biodiversity (Species loss index value)
SLI per kg
The pressure the product places on wildlife and natural habitats, reported using a species loss index. Producing food changes the land it uses, and that affects the range of species able to live there. This metric estimates the scale of that effect.
Land Use (m2 per year)
m²*yr per kg
How much land is occupied to produce the product, and for how long. The unit combines the two: one square metre used for one year is one m²*yr. Measuring it this way means a crop that occupies land briefly is not treated equally as one that ties up the same area for several seasons.
Carbon Intensity (Mondra’s calculated score between 1-99 based on their calculations/methodology)
Carbon Intensity (CI) scores are displayed alongside all individual eco impacts. These support non-expert users to understand, at a glance, whether the Co2 value displayed (eg. 12.3 kg CO2 eq.) is good or bad. Mondra's intensity scoring empowers retailers and brand owners to confidently score the environmental impact of their products on pack.
Data Quality Score (The quality of the data used to provide the environmental impact values based on the primary data provided)
The Data Quality System provides simple, at a glace communication. DQS is a living metric, where primary data drives improvement. DQS is averaged over five metrics on a 1.0 - 5.0 scale. To ensure DQS is an accessible indicator, a clearly worded colour coded system is applied.
The Data Quality System provides a fully transparent, methodologically robust & scalable data quality measurement system, with communication framework aligned to LCA / Product Footprinting standards. The DQS enables you to track data quality over time, monitor data and improve the accuracy of your primary data.
You may also be interested in…


You may also be interested in…
Environmental scoring is coming to Erudus specifications!
ReadYou may also be interested in…
You may also be interested in…


